The last time I wrote about this project was over six weeks ago in December.

About two weeks ago one of the NRCS representatives came to check on the progress of the pasture seeding. Not a great photo, but he is putting down a grid to aid in evaluating plant growth.

This is what it looks like and I should have asked more about it. I didn’t see him mark where he put it or count plants. We were talking about generalities in the pasture, but now I’m going to ask. Did you know that my degree from UC Davis is in Range and Wildlands Science? So I recognize this for what it is–a tool for analysis of plant germination and growth–but we didn’t talk about it.
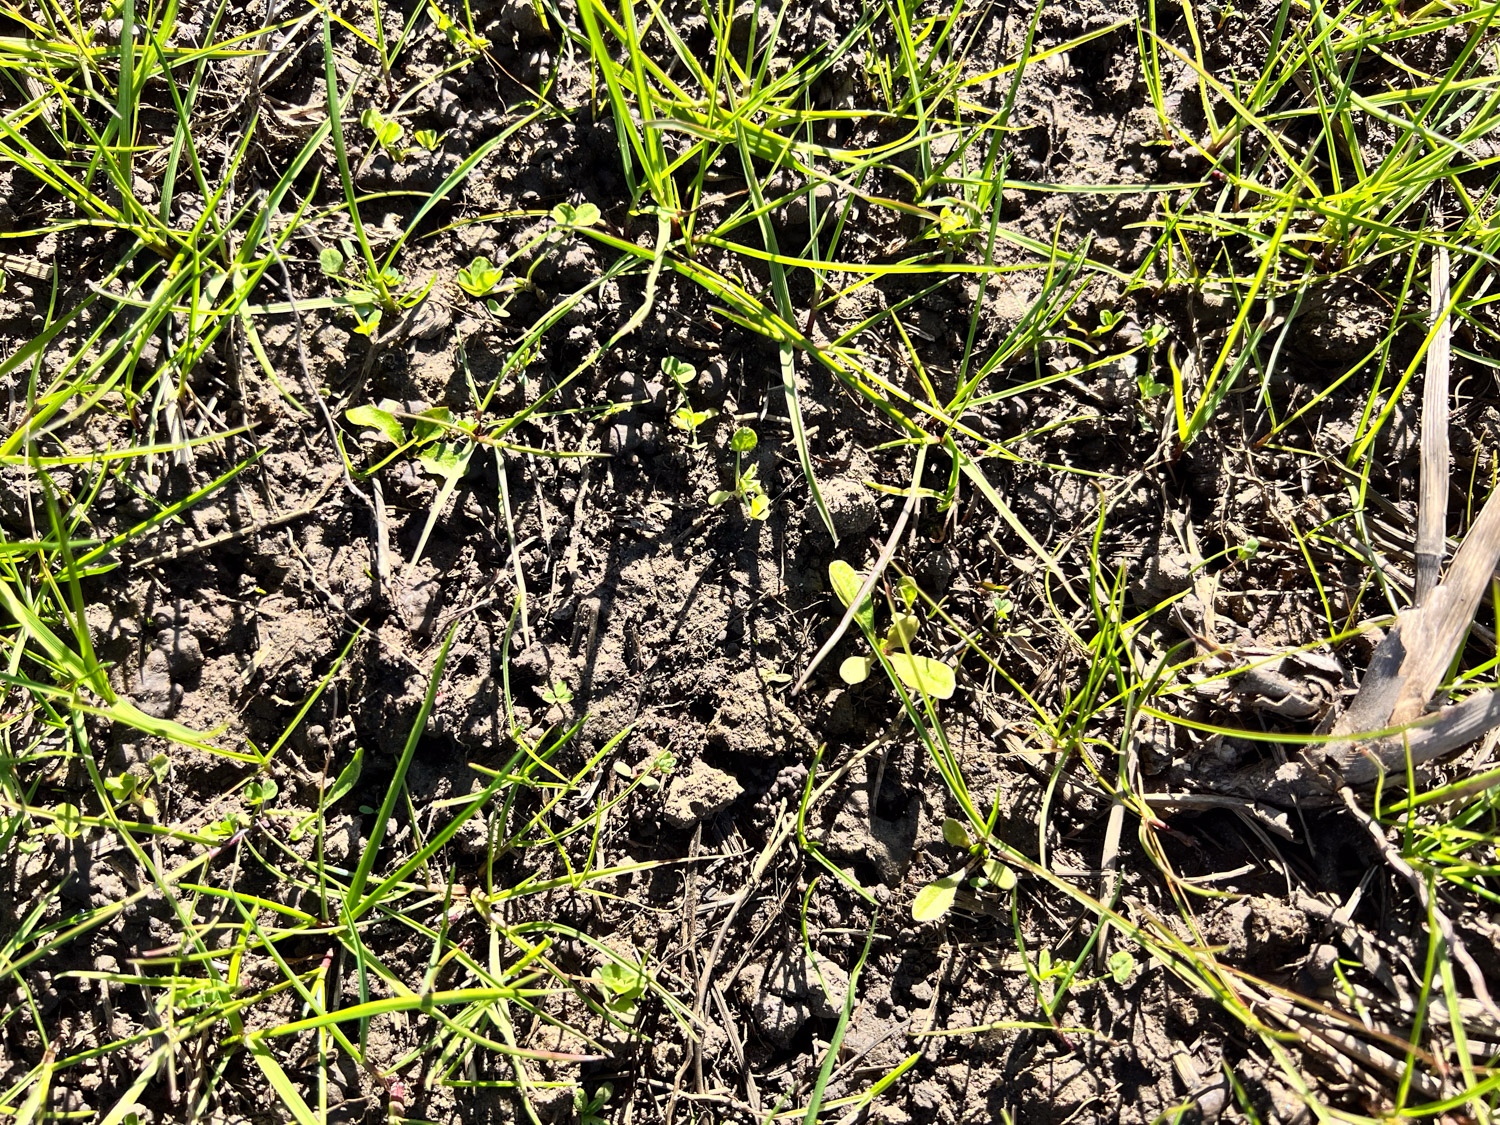
Do you see how hard it is to evaluate growth when you look across the field and not straight down? Compare the first photo to the next two. In the second photo close up photo it shows grasses and forbs. There were three of each in the seed mix. We identified clover and chicory, but I don’t see trefoil yet. I can’t identify the grasses.

This is the field west of the barn. The grass growth is thicker here, at least in that small area.

This is a photo taken from the same spot as the last one, but looking north. This is the check where there was traffic from the people working on the irrigation system. We’re thinking that it probably needs discing again.
Last week we met with a representative from the company that makes the soil moisture sensors that were installed. He showed us how to see the info generated by the two sensors and we talked about how we’ll use that. They are sensors are at the south end of the field, one near the west edge and one in the center, still in line-of-sight with the sensor in the northwest corner.
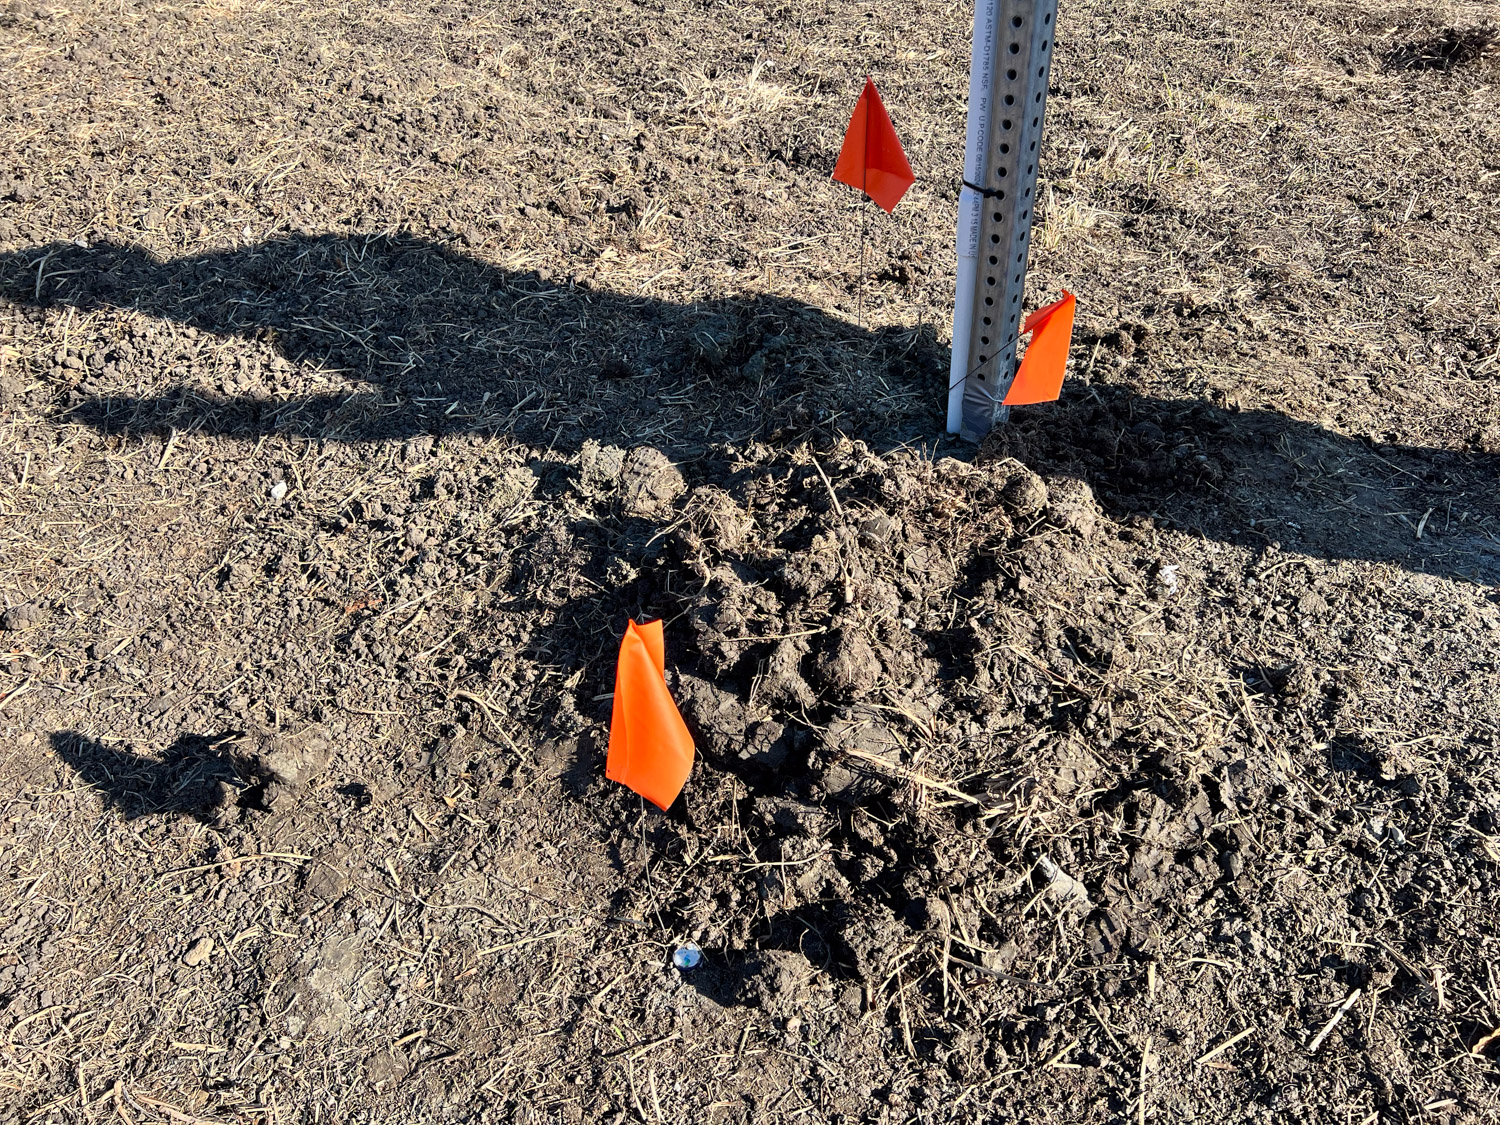
The flag in the foreground marks where the sensor is at this station.

This is what it looks like inside the box.
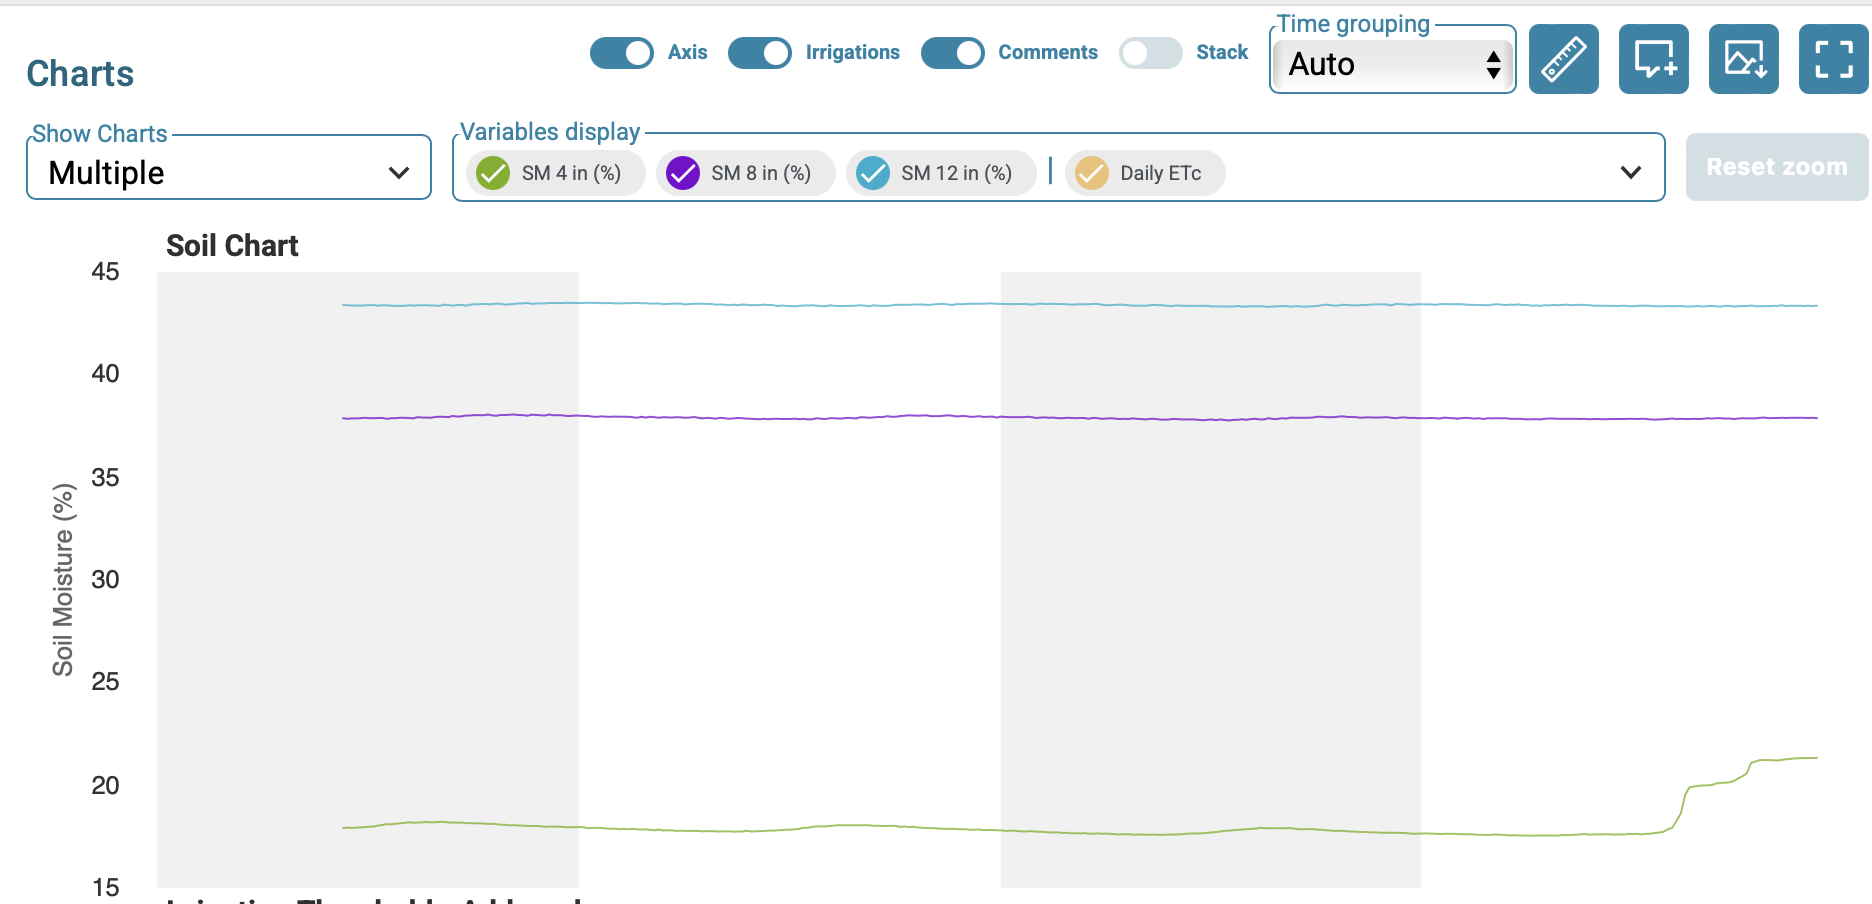
We haven’t had rain for a month and there have been north winds that make things dry out even more. We were getting worried about this new pasture. Those little seedlings need moisture in their root zone to stay alive. This is a screenshot of what the sensor shows for one station. The gray and white columns each indicate a day. The horizontal green line is 4″ depth, purple is 8″, and blue is 12″. You can tell that today’s 1/4″ rain just started to soak in.

Here is what the other sensor shows. The scale on the left axis is different. This 4″ level had more moisture to begin with than the other two. We will be learning how to use this info. There is a lot more available. I just copied this portion for now. This will sure be interesting to follow.
