As part of our Pasture Renovation project last fall and into this year, supported by NRCS (Natural Resources Conservation Service) we installed two Soil Moisture sensors and a flowmeter. (If you want to start from the beginning to see photos of this project search in the blog for the topic, Pasture and Irrigation Renovation.) The goal of having these sensors is to aid in planning the timing of irrigation. However I find it interesting to see what is going on now with the rain.
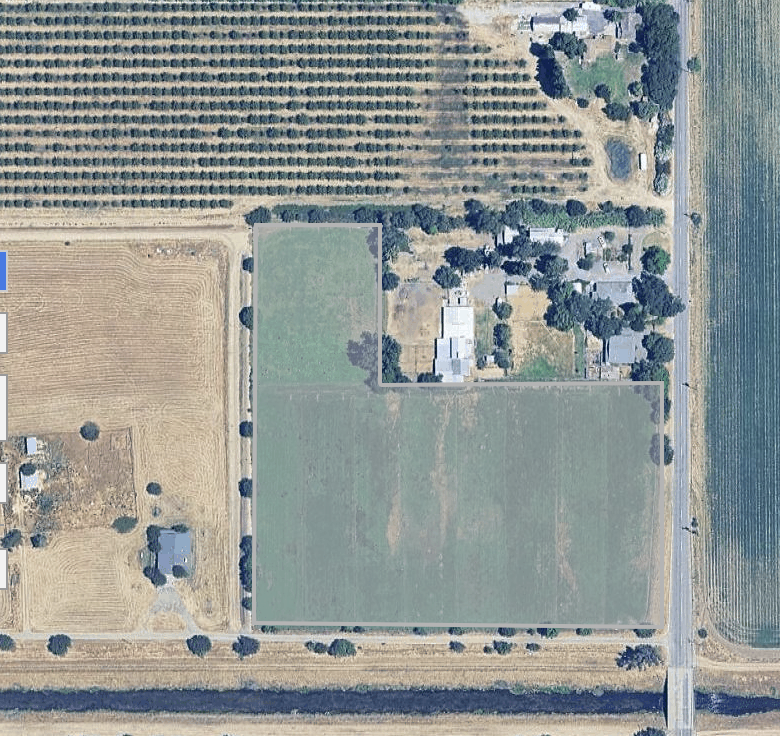
I took the photo below from the website we use to read the soil moisture info. I thought it would be interesting to see the aerial view of the farm. Our 10-acre farm is the green square in the center (plus buildings). There is an almond orchard north of us and alfalfa on the east. When I write about Across the Road that is what I’m talking about. There is a large canal on the south just past the driveway that leads to the neighbors on the west. This photo is from before we did the work in 2024 and still had an open ditch for irrigating. You can tell that we had eight fence lines in the south pasture. There are now nine interior fence lines running north-south, each 60′ apart. There are valves in the new irrigation pipeline every 30′, so when I graze I can either graze the 60′ wide strip or split that into two 30′ wide paddocks.
This photo provides a good visual for the post I wrote (and plan to do more) about sheep grazing Across the Road. The trucks in that post were parked just across the main road and between the trees just south of the house on our side of the road and the bushes on the other side just south of our tree.
Back to the purpose of this post, the soil moisture sensors.

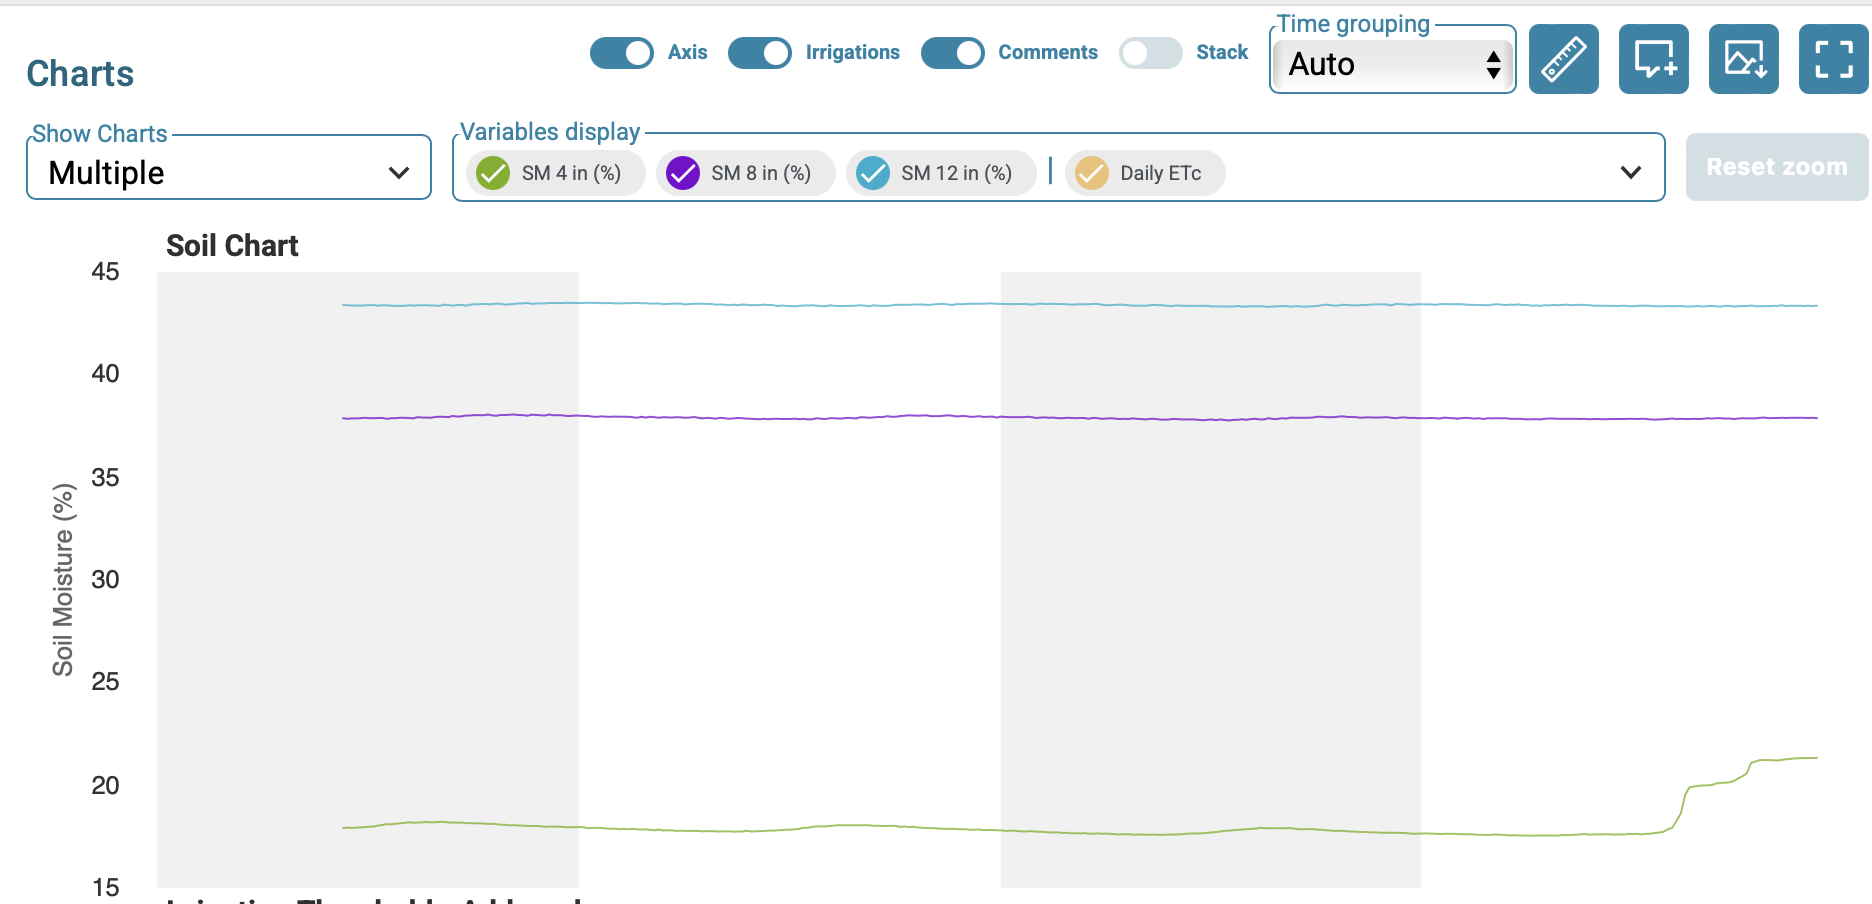
Let me explain what you’re seeing. The red line is the flow meter. It’s at zero except when we are irrigating. That shows the water coming into the pipeline from SID (Solano Irrigation District). It took some tweaking to get it right. The July reading stopped but we didn’t know why. By early August we had the solution. We needed a screen over the intake area so that weeds and branches didn’t physically impede the propellor going around in the pipeline.
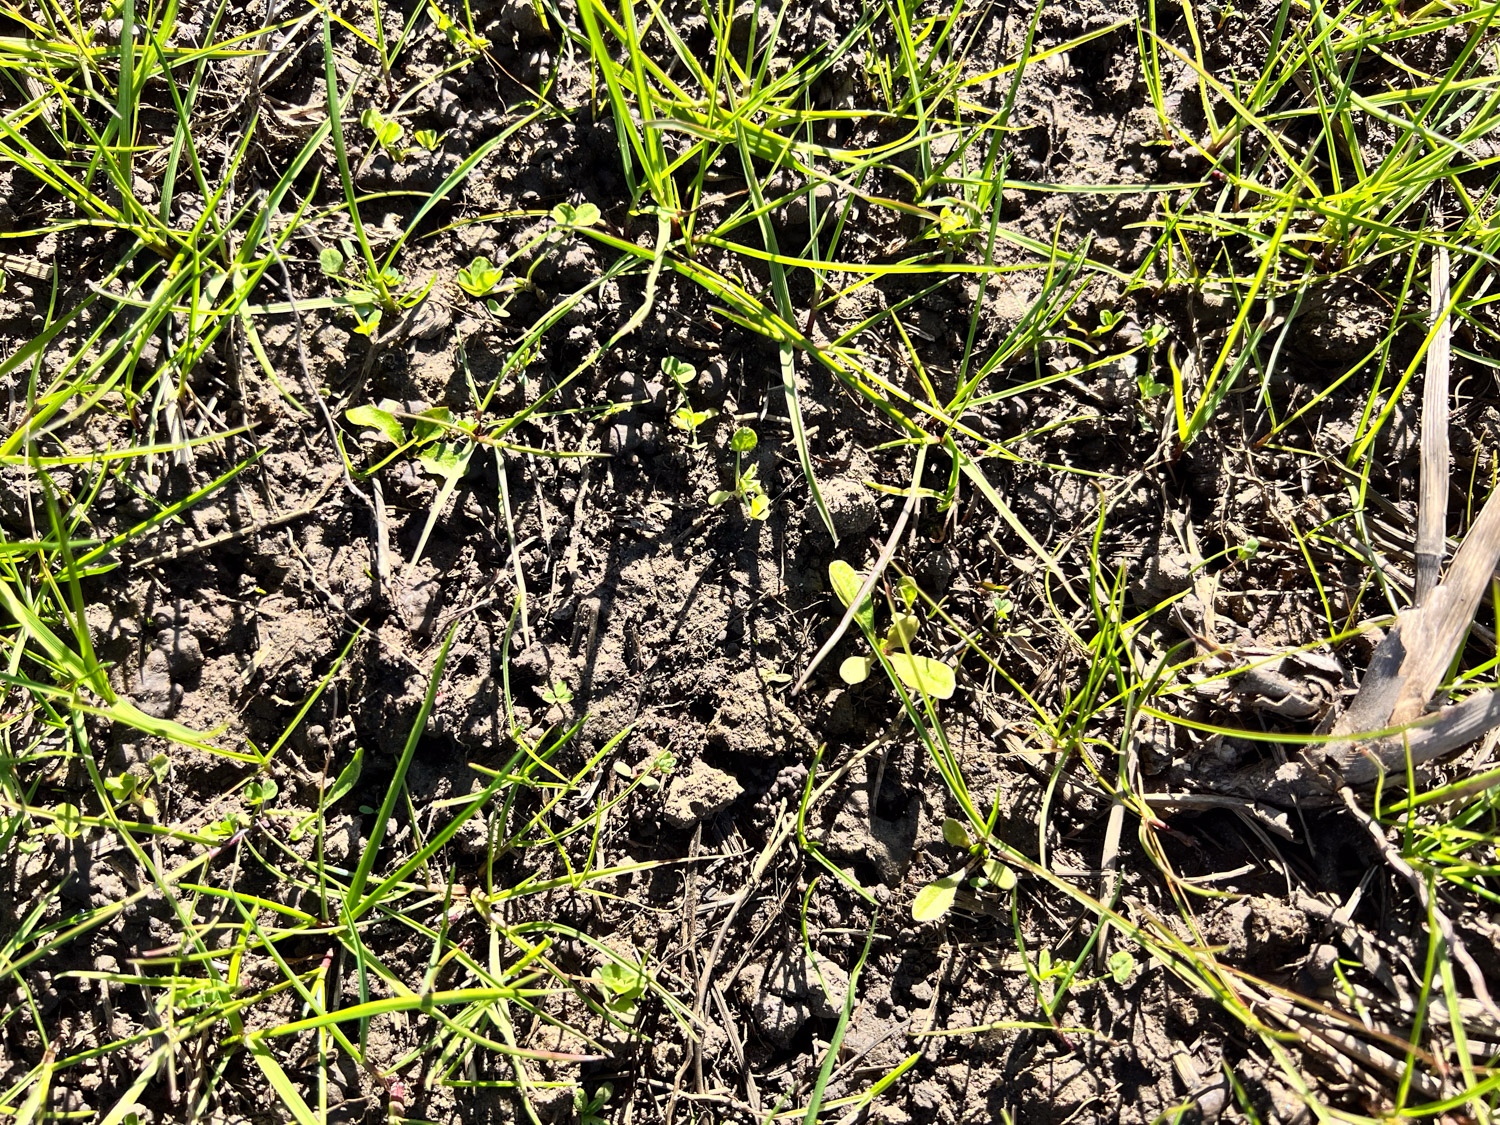
About the other colors. There are two soil moisture sensors. Both are at the south end of the pasture. Now that I have added the aerial photo I can refer you to that–southwest corner and south edge about 2/3 of the way to the east. They are not right on the south fence line but about 20′ north of that.
Each sensor measure soil moisture at three depths–4″, 8″, and 12″. The goal is to know the moisture in the root zone of the pasture plants. Those depths are color coded: green is 4″, purple is 8″, and blue is 12″. When I look at the chart I have to orient myself to know that I’m not seeing the soil profile as it is if I am standing there. I think it as green for the plants and blue for the deepest water. Then it makes sense. The darker colors are the sensor on the west and the lighter colors are the east sensor. So you can see that when we irrigate or it rains all levels being measured are mostly saturated. The 4″ depth dries out most quickly while it takes longer for the other two to lose moisture, and during the summer they don’t lose nearly as much moisture as the ones closer to the surface.
November 13 and 14 it rained about 2″. The weather stayed foggy for weeks after that and into December. The soil moisture level remained high. I assume that is because #1- It was so foggy and damp, and #2 – plant demand slowed way down because of the cold and the season.
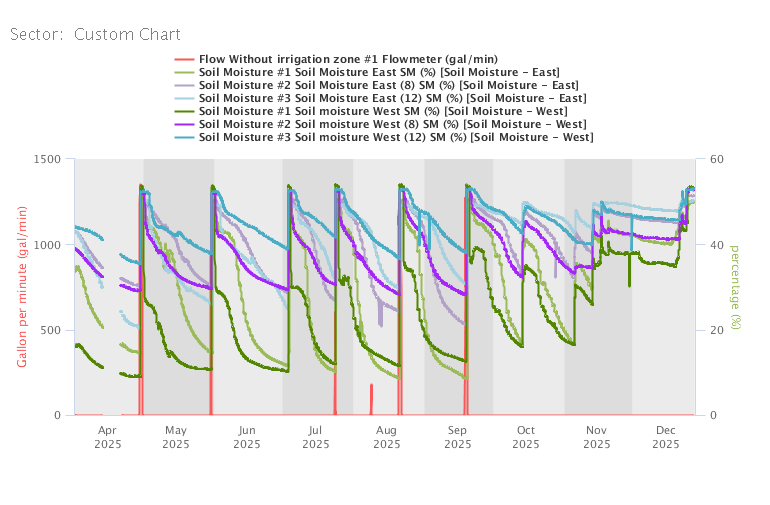
To be thorough I thought I’d show you most of the year. Early May shows our first irrigation. We were having the problem with the flowmeter but didn’t figure out the solution until August.
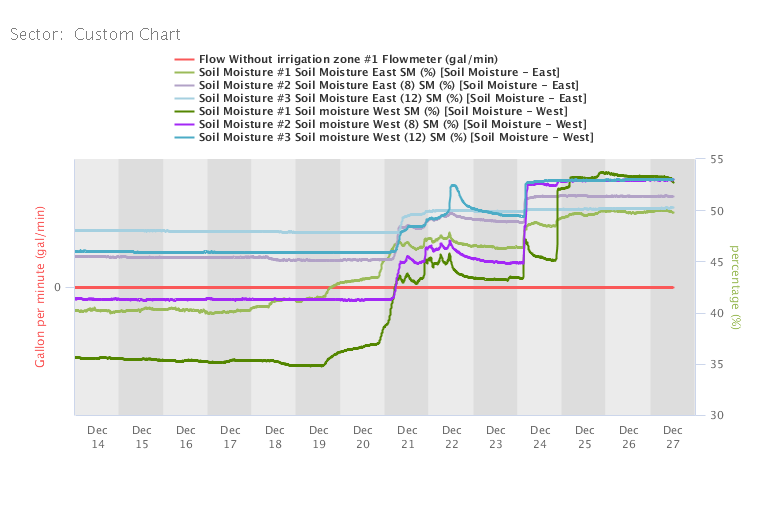
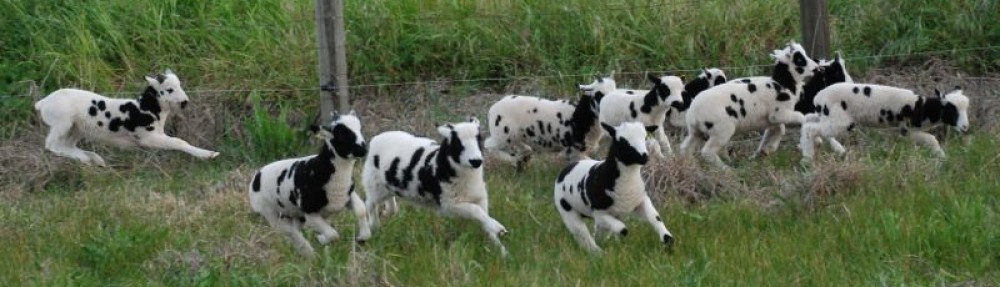
This view of the last two weeks makes it easier to see what’s going on. This explains why I have the sheep blocked off the pasture now. It is very wet, and I think it is better for the sheep and the pasture to have them off of it. It’s not that sheep can’t handle some rain, but, just like you don’t stomp around in your vegetable garden when you’re irrigating, we don’t want to impact the soil as 60 sheep (240 hooves) would.
Now I’ve convinced myself that I made the right decision to lock them in for now.